January 22, 2010
Signs of a Market Bottom…
Office and industrial vacancy rates increased every quarter last year, but the rate of increase declined as the year progressed. In the four quarters of 2009, office vacancy increased sequentially by 80, 100, 50 and 30 basis points while industrial vacancy increased by 70, 60, 30 and 20 basis points. Absorption followed a similar trajectory: Totals were negative every quarter last year, but fourth quarter losses were the shallowest.
We are hearing about other signs of a market bottom:
 This could be the year of the long-term lease, replacing the one-year extensions prevalent in 2009. Tenants whose leases expired last year shied away from new long-term commitments given the bleak outlook. But the economy has started to grow again, and profits held up remarkably well through the recession thanks to corporate cost-cutting measures including employee layoffs. Tenants are becoming confident enough to lock in the great deals on offer from landlords.
 - Tenants’ top priority last year was getting the cheapest space, but many tenants are becoming receptive to upgrading their space, i.e. willing to pay a little more for better space. In the retail market, some tenants were shut out of the best locations during the boom. But vacancies have opened up even in the best centers, and retailers are looking at upgrading their locations.
- In a few markets, landlord psychology is beginning to shift. The office vacancy rate continues to rise in San Francisco, but some property owners have reduced their concession packages, believing the worst has passed.
- Industrial brokers in some locations including Tampa and Columbus are reporting increasing activity by tenants looking to take advantage of very low rental rates.
Courtesy of Robert Bach, SVP, Chief Economist, Grubb & Ellis
For a free consultation of your commercial real estate needs please contact Sean Thompson at 406.539.0082 or sean.thompson@mtcommercialre.com OR Joe Cobb at 406.579.2999 or joe.cobb@mtcommercialre.com. www.MTcommercialRE.com
 Leave a Comment » |
  Market Reports | Tagged: Belgrade Buisness, Belgrade Commercial Real Estate, Belgrade Office, Bozeman, Bozeman Business, Bozeman Commercial Land, Bozeman Commercial Real Estate, Bozeman Office, Bozeman Real Estate, Bozeman Retail, Bozeman Warehouse, Commercial Investment, Commercial Real Estate, Commercial Real Estate Bozeman, Commercial Real Estate Forecast, Grubb & Ellis, Montana Business, Montana Commercial, Montana Commercial Real Estate, Montana Real Estate, Office For Lease, Office For Sale, Retail For Lease, Retail For Sale, Retail Lease, Warehouse For Lease, Warehouse For Sale |
  Permalink
 Posted by Sean Thompson
December 28, 2009

Home Sales In Millions. Source: Census Bureau, National Association of Realtors, Grubb & Ellis
Sales trends for new and existing homes parted company in November. The National Association of Realtors reported that existing home sales rose 7.4 percent from October to a seasonally adjusted annual rate of 6.54 million units, the highest level since February 2007. Meanwhile, the Census Bureau reported that new home sales sank to a seasonally adjusted annual rate of 355,000 units, down 11.3 percent from October and the weakest level in seven months. Sales of foreclosed and other distressed properties are inflating existing home sales at the expense of new home sales, having accounted for 33 percent of existing sales last month. The tax credit for first-time buyers, which was set to expire at the end of November, helped both new and existing home sales. But new home sales are counted when the sales contract is signed or a deposit is accepted while existing home sales are counted when the sale is closed, meaning that new home sales attributable to the tax credit likely showed up earlier in the data. The extension of the tax credit through April 2010 and its expansion to include some repeat buyers will provide a boost to home sales as the spring selling season gets underway. Besides ending the tax credit next year, the government will wind down its purchases of mortgage-backed securities, which has helped keep mortgage rates low. The withdrawal of these support programs will be a test to see if the housing market can continue to recover on its own or whether there could be another leg down in prices as foreclosures continue to mount. Courtesy of Robert Bach, SVP, Chief Economist, Grubb & Ellis.
For a free consultation of your commercial real estate needs please contact Sean Thompson at 406.539.0082 or sean.thompson@grubb-ellis.com OR Joe Cobb at 406.579.299 or joe.cobb@grubb-ellis.com. www.MTcommercialRE.com
 Leave a Comment » |
  Market Reports | Tagged: Belgrade Buisness, Belgrade Commercial Real Estate, Belgrade Office, Bozeman, Bozeman Business, Bozeman Commercial Land, Bozeman Commercial Real Estate, Bozeman Office, Bozeman Real Estate, Bozeman Retail, Bozeman Warehouse, Commercial Investment, Commercial Real Estate, Commercial Real Estate Bozeman, Commercial Real Estate Forecast, Grubb & Ellis, Montana Business, Montana Commercial, Montana Commercial Real Estate, Montana Real Estate, Office For Lease, Office For Sale, Retail For Lease, Retail For Sale, Retail Lease, Warehouse For Lease, Warehouse For Sale |
  Permalink
 Posted by Sean Thompson
November 30, 2009

Industrial Vacancy vs. Warehouse Rent*
The drivers of demand for industrial space are beginning to firm: global trade, freight transportation, manufacturing activity and retail sales all seem to have hit bottom and either leveled out or posted slight gains recently. But the pending recovery is not yet strong enough to reverse the slide in occupier demand for industrial space. Expect the leasing market to soften further in 2010 with the vacancy rate hitting a peak of 11.4 percent by year end, a percentage point above its 2009-Q3 reading. The asking rental rate for warehouse/distribution space is projected to fall another 5 percent in 2010. In 2011, the vacancy rate should begin a slow descent while rent may slide another 2 percent due to the lingering excess of available space. The signs of improvement are there, but the recovery will be slow. Courtesy of Robert Bach, Chief Economist, SVP, Grubb & Ellis.
For a free consultation of your commercial real estate needs please contact Sean Thompson at 406.539.0082 or sean.thompson@grubb-ellis.com OR Joe Cobb at 406.579.2999 or joe.cobb@grubb-ellis.com. www.MTcommercialRE.com
 Leave a Comment » |
  Market Reports | Tagged: Belgrade Buisness, Belgrade Commercial Real Estate, Belgrade Office, Bozeman, Bozeman Business, Bozeman Commercial Land, Bozeman Commercial Real Estate, Bozeman Office, Bozeman Real Estate, Bozeman Retail, Bozeman Warehouse, Commercial Investment, Commercial Land, Commercial Real Estate, Commercial Real Estate Forecast, Grubb & Ellis, Market Reports, Montana Business, Montana Commercial, Montana Commercial Real Estate, Montana Real Estate, Warehouse For Lease, Warehouse For Sale |
  Permalink
 Posted by Sean Thompson
November 2, 2009
Personal Consumption Expenditures
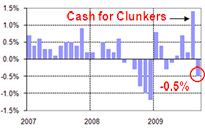 Office leasing activity through the third quarter is off by one-third from the same period in 2008, yet the share of activity by the size of tenant is surprisingly consistent. Office tenants leasing less than 10,000 square feet accounted for 29 percent of the total square footage leased this year while tenants needing less than 25,000 square feet comprised more than half of the total. Many of these tenants are branch offices of larger companies, but the importance of smaller tenants to the office market, particularly in non-headquarters cities, may affect the speed of the recovery. Small companies are the engine of job growth in the U.S., and the extent to which they have difficulty borrowing in order to expand could delay the recovery of both the labor market and the office.
Source: U.S. Bureau of Economic Analysis, Grubb & Ellis
For a free consultation of your commercial real estate needs please contact Sean Thompson at 406.539.0082 or sean.thompson@grubb-ellis.com OR Joe Cobb at 406.579.2999 or joe.cobb@grubb-ellis.com. www.MTcommercialRE.com
 Leave a Comment » |
  Market Reports | Tagged: Belgrade Buisness, Belgrade Commercial Real Estate, Belgrade Office, Bozeman, Bozeman Business, Bozeman Commercial Land, Bozeman Commercial Real Estate, Bozeman Office, Bozeman Real Estate, Bozeman Retail, Bozeman Warehouse, Commercial Investment, Commercial Real Estate, Commercial Real Estate Bozeman, Commercial Real Estate Forecast, Downtown Bozeman, Grubb & Ellis, Montana Business, Montana Commercial, Montana Commercial Real Estate, Montana Real Estate |
  Permalink
 Posted by Sean Thompson
August 31, 2009
Last week’s article covered the basics of letter-shaped recoveries and how the terms are being used in current economic discussions. But what about the shape of the pending recovery? A “U” is the most likely scenario. Though GDP is expected to turn positive in the current quarter, the labor market could languish for several more months, perhaps through the first half of 2010. Pessimists anticipate a W-shaped recovery. Following a burst of activity led by inventory restocking and stimulus spending, this group expects growth to fade in 2010 as households remain focused on saving rather than spending. Inflation hawks reside in the “W” camp, too. They think the Fed will be forced to clamp down on a burst of inflation caused by too much liquidity and government spending, thus triggering a follow-on recession similar to the double-dip profile of the early 1980s. On the other side of the debate, optimists anticipate a V-shaped recovery. They believe that employers, panicked by the frozen credit markets last fall, laid off too many workers and will need to staff up more quickly than expected. The optimists also point to the strong recovery under way in China and the surprisingly rapid end of the downturn in parts of Europe, which was thought to be trailing the U.S. For the commercial real estate industry, it would be most prudent to plan for a sluggish U-shaped recovery with the labor market unlikely to make a decisive turn for the better before the middle of 2010. A V-shaped recovery would be beneficial, although it could set the stage for inflation and a double-dip recession if it forces the Fed to withdraw liquidity and raise interest rates at a rapid pace. Source: U.S. Bureau of Labor Statistics, Grubb & Ellis.
For a free consultation of your commercial real estate needs please contact Sean Thompson at 406.539.0082 or sean.thompson@grubb-ellis.com OR Joe Cobb at 406.579.2999 or joe.cobb@grubb-ellis.com. www.MTcommercialRE.com.
 Leave a Comment » |
  Market Reports | Tagged: Belgrade Commercial Real Estate, Belgrade Office, Bozeman, Bozeman Business, Bozeman Commercial Real Estate, Bozeman Office, Bozeman Real Estate, Bozeman Retail, Bozeman Warehouse, Commercial Investment, Commercial Real Estate, Commercial Real Estate Bozeman, Commercial Real Estate Forecast, Grubb & Ellis, Montana Business, Montana Commercial, Montana Commercial Real Estate, Montana Real Estate |
  Permalink
 Posted by Sean Thompson
March 17, 2009
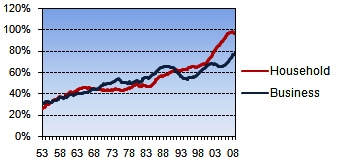
Household And Business Debt As Share Of GDP
This week’s market insight takes a look at household and business debt as a share of GDP. As more consumers and businesses are increasing their savings and paying down their debt, they’re in turn contributing to the downturn in the economy by decreasing their spending. For the full report please visit: http://www.tinyurl.com/d8yhv4.
For a free consultation of your commercial real estate needs please contact Sean Thompson at 406.539.0082 or sean.thompson@grubb-ellis.com OR Joe Cobb at 406.579.2999 or josephcobb@gmail.com. www.MTcommercialRE.com
 Leave a Comment » |
  Market Reports | Tagged: Bozeman Business, Bozeman Commercial Real Estate, Bozeman Real Estate, Commercial Investment, Commercial Real Estate, Commercial Real Estate Bozeman, Commercial Real Estate Forecast, Grubb & Ellis, Montana Commercial, Montana Commercial Real Estate |
  Permalink
 Posted by Sean Thompson
March 10, 2009
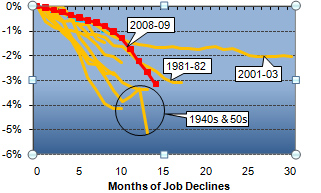 The national labor market shrank for the 14th consecutive month in February as employers eliminated 651,000 net payroll jobs. Looking forward, job losses are expected to continue through 2009 along with a possible 2 to 3 year softening cycle for commercial real estate. For the full report please click here: http://www.tinyurl.com/cf6ds8 For a free consultation on your commercial real estate needs please contact Sean Thompson @ 406.539.0082 or sean.thompson@grubb-ellis.com OR Joe Cobb @ 406.579.2999 or josephcobb@gmail.com www.MTcommercialRE.com
 Leave a Comment » |
  Bozeman, Bozeman Real Estate, Commercial Real Estate Bozeman, Montana Commercial Real Estate, Uncategorized | Tagged: Bozeman Commercial Real Estate, Commercial Investment, Commercial Real Estate, Commercial Real Estate Bozeman, Commercial Real Estate Forecast, Grubb & Ellis, Montana Business, Montana Commercial, Montana Commercial Real Estate, Montana Real Estate |
  Permalink
 Posted by Sean Thompson
February 25, 2009
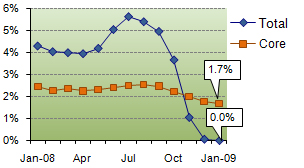
Inflation, Total vs. Core
This week’s market insight takes a look at inflation and the Consumer Price Index. The Consumer Price Index increased slightly in January ’09 from December ’08, but the year-over-year trend shows that the rate of inflation has been easing since last summer, led by the collapse in oil prices. For the compete report please visit: http://www.tinyurl.com/cnzp9j
For a free consultaion of your commercial real estate needs please contact Sean Thompson at 406.539.0082 or sean.thompson@grubb-ellis.com OR Joe Cobb at 406.579.2999 or josephcobb@gmail.com www.MTcommercialRE.com
 Leave a Comment » |
  Bozeman, Bozeman Real Estate, Commercial Real Estate Bozeman, Montana Commercial Real Estate | Tagged: Bozeman Commercial Real Estate, Commercial Investment, Commercial Real Estate, Commercial Real Estate Forecast, Grubb & Ellis, Montana Business, Montana Commercial, Montana Commercial Real Estate, Montana Real Estate |
  Permalink
 Posted by Sean Thompson
February 4, 2009

Non-Residential Construction Inflation
Construction cost inflation for commercial real estate has leveled off sharply as lending and new starts have plunged. Inflation in the broader economy, which was an issue as late as last summer, has taken a back seat to the fear of deflation as demand dries up across the globe, sapping business pricing power and profits. However, it is too early to be concerned about deflation. For the full report please visit http://www.tinyurl.com/bz5xx2.
For a free consultation of your commercial real estate needs please contact Sean Thompson @ 406.539.0082 or sean.thompson@grubb-ellis.com OR Joe Cobb @ 406.579.2999 or josephcobb@gmail.com www.MTcommercialRE.com
 Leave a Comment » |
  Bozeman, Bozeman Real Estate, Commercial Real Estate Bozeman, Montana Commercial Real Estate, Uncategorized | Tagged: Bozeman Commercial Real Estate, Commercial Investment, Commercial Real Estate, Commercial Real Estate Bozeman, Commercial Real Estate Forecast, Grubb & Ellis, Montana Business, Montana Commercial, Montana Commercial Real Estate, Montana Real Estate |
  Permalink
 Posted by Sean Thompson
January 28, 2009
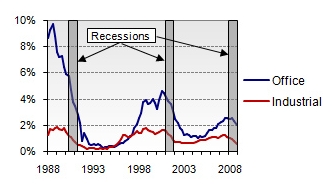 Nationally, the 80 million square feet of office space under construction will push the office vacancy rate from 14.8 percent at year-end 2008 to 16.5 percent. For industrial space, the 72 million square feet under way will push the industrial vacancy rate from 8.8 percent at year-end 2008 to 9.3 percent. For the full market update please click here: http://www.tinyurl.com/dlpr8c.
For a free consultation of your commercial real estate needs please contact Sean Thompson @ 406.539.0082 or at sean.thompson@grubb-ellis.com or Joe Cobb @ 406.579.2999 or at josephcobb@gmail.com. www.MTcommercialRE.com
 Leave a Comment » |
  Bozeman, Bozeman Real Estate, Commercial Real Estate Bozeman, Montana Commercial Real Estate, Uncategorized | Tagged: Belgrade Commercial Real Estate, Belgrade Office, Bozeman Commercial Real Estate, Bozeman Office, Bozeman Retail, Bozeman Warehouse, Commercial Investment, Commercial Real Estate, Commercial Real Estate Bozeman, Commercial Real Estate Forecast, Grubb & Ellis, Montana Business, Montana Commercial, Montana Commercial Real Estate, Montana Real Estate, Office For Lease, Office For Sale, Retail For Lease, Retail For Sale, Retail Lease, Warehouse For Lease, Warehouse For Sale |
  Permalink
 Posted by Sean Thompson
 This could be the year of the long-term lease, replacing the one-year extensions prevalent in 2009. Tenants whose leases expired last year shied away from new long-term commitments given the bleak outlook. But the economy has started to grow again, and profits held up remarkably well through the recession thanks to corporate cost-cutting measures including employee layoffs. Tenants are becoming confident enough to lock in the great deals on offer from landlords.


 Posted by Sean Thompson

 Office leasing activity through the third quarter is off by one-third from the same period in 2008, yet the share of activity by the size of tenant is surprisingly consistent. Office tenants leasing less than 10,000 square feet accounted for 29 percent of the total square footage leased this year while tenants needing less than 25,000 square feet comprised more than half of the total. Many of these tenants are branch offices of larger companies, but the importance of smaller tenants to the office market, particularly in non-headquarters cities, may affect the speed of the recovery. Small companies are the engine of job growth in the U.S., and the extent to which they have difficulty borrowing in order to expand could delay the recovery of both the labor market and the office.
 The national labor market shrank for the 14th consecutive month in February as employers eliminated 651,000 net payroll jobs. Looking forward, job losses are expected to continue through 2009 along with a possible 2 to 3 year softening cycle for commercial real estate. For the full report please click here:

 Nationally, the 80 million square feet of office space under construction will push the office vacancy rate from 14.8 percent at year-end 2008 to 16.5 percent. For industrial space, the 72 million square feet under way will push the industrial vacancy rate from 8.8 percent at year-end 2008 to 9.3 percent. For the full market update please click here: